# Interactive World Map
An interactive, customizable world map library built with Plotly.js that provides choropleth visualization with bubble markers, configurable color schemes, and real-time controls.
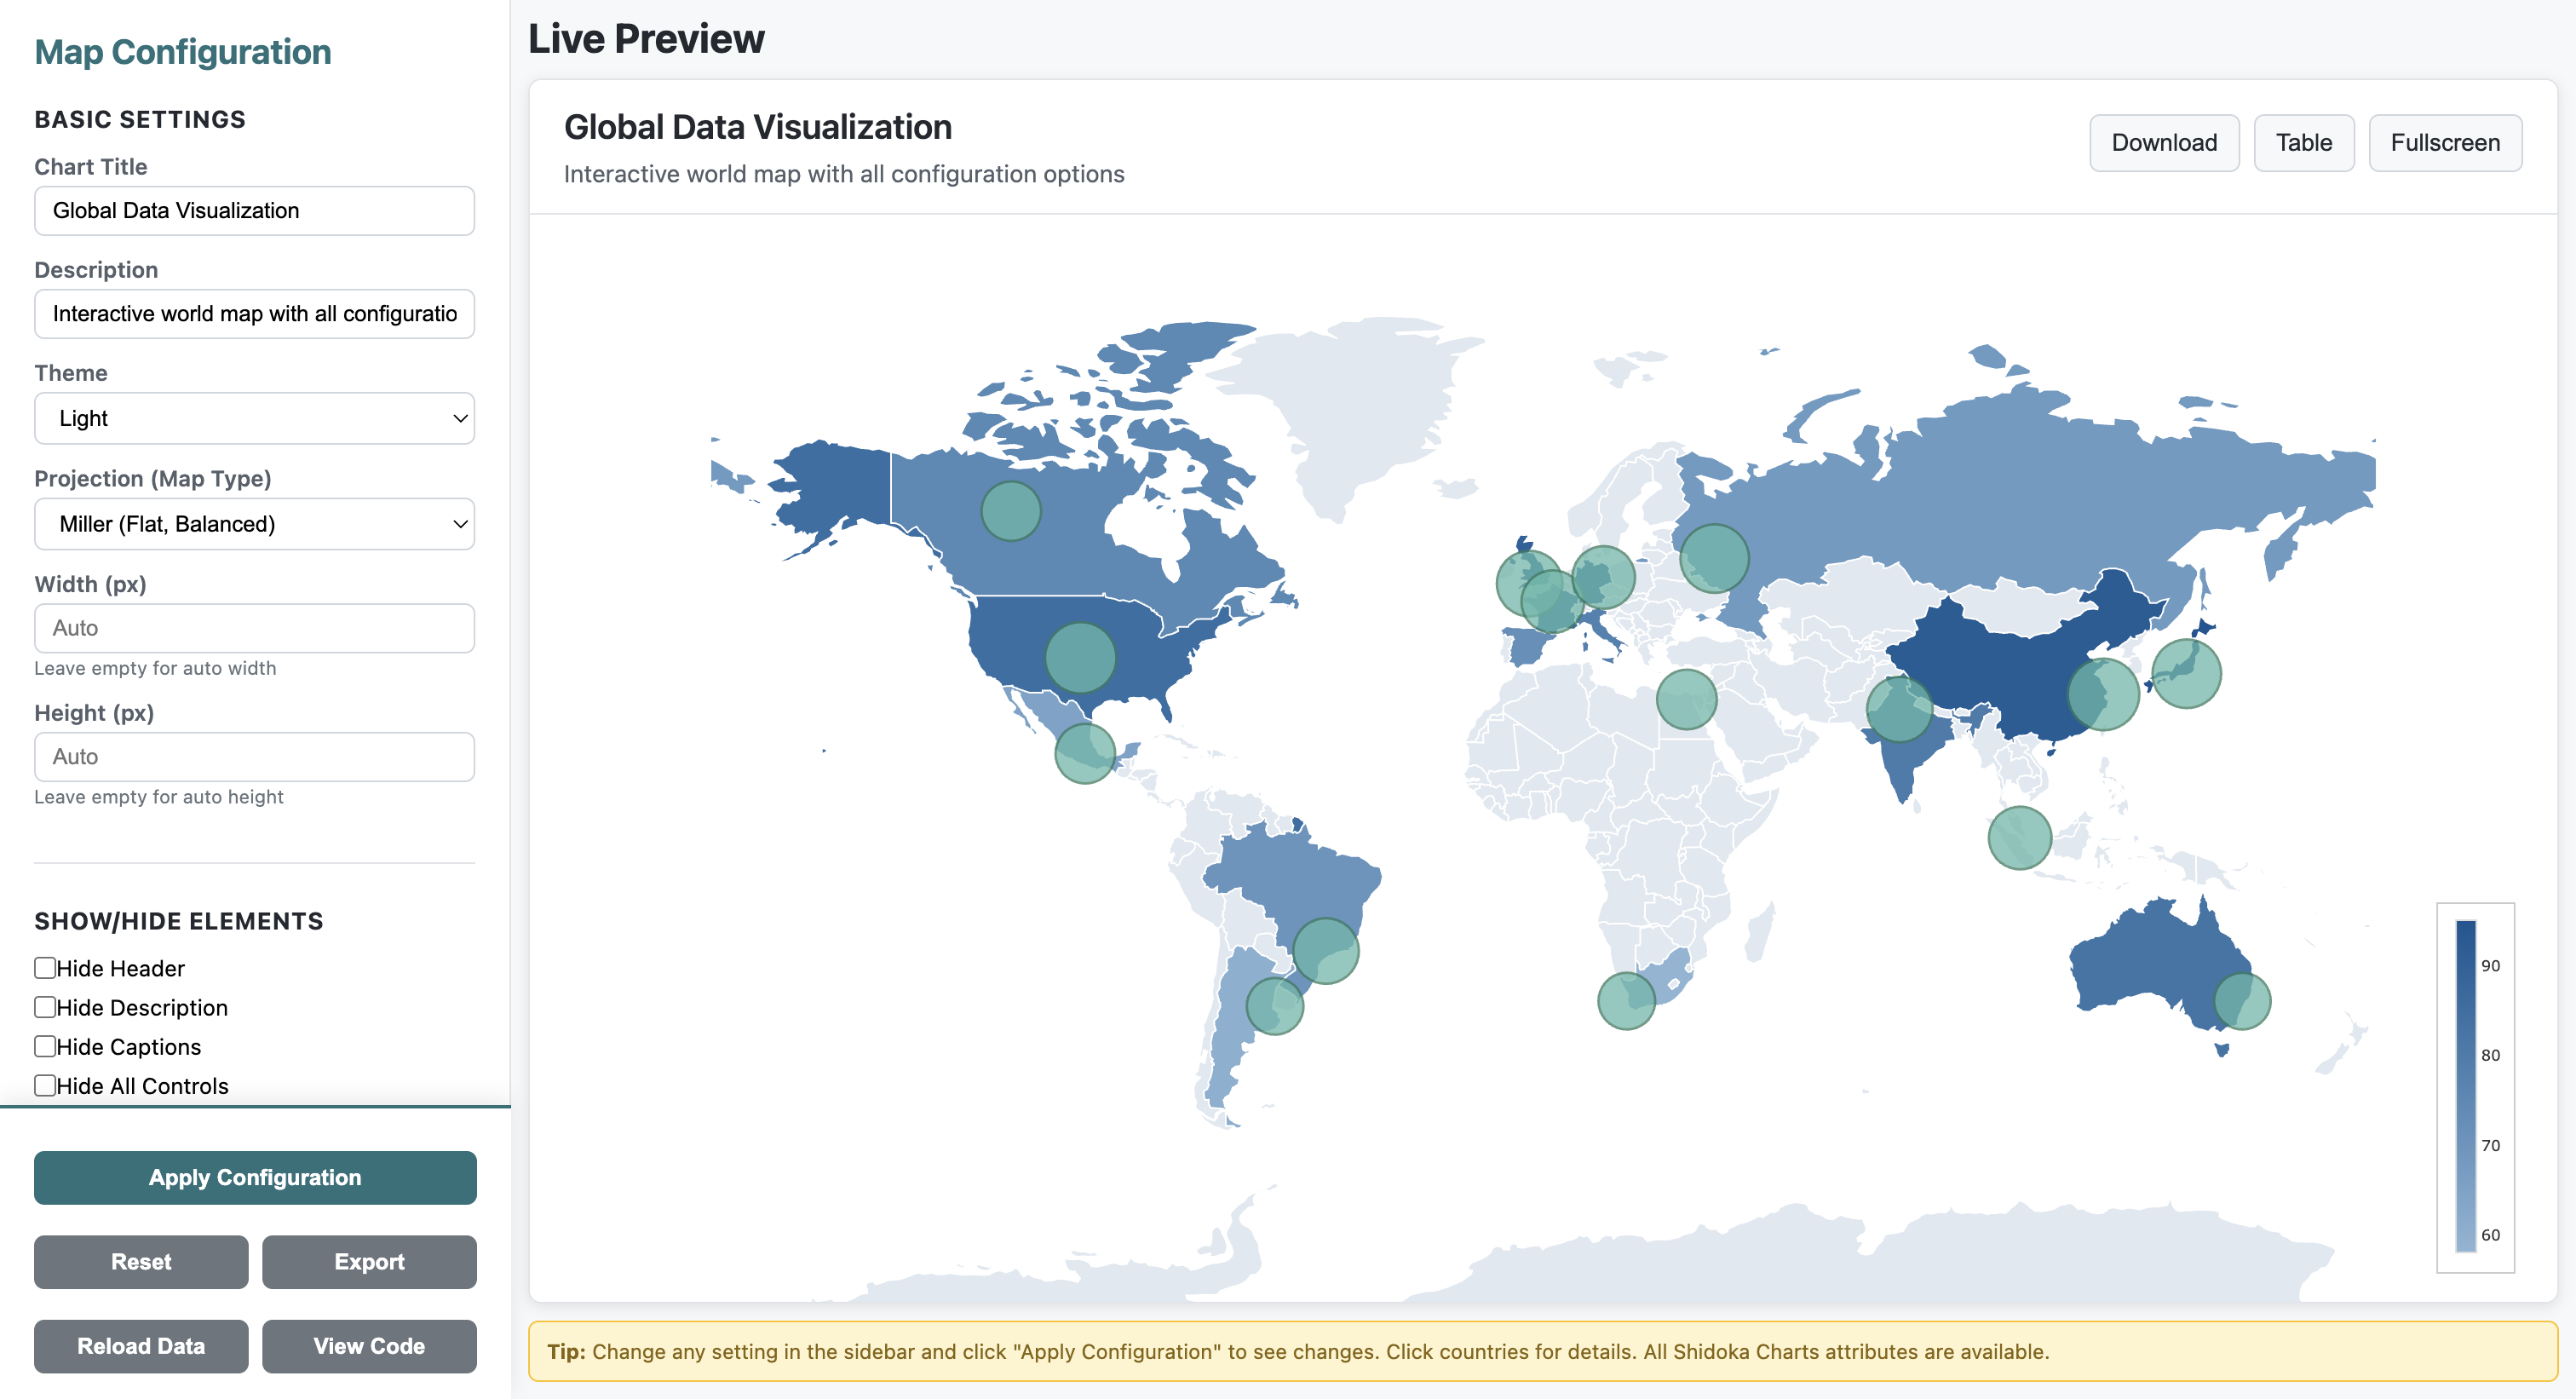
**[ View Live Demo](https://world-map-woad-three.vercel.app/)**
## Features
- **Choropleth Visualization**: Color-coded countries based on data values
- **Bubble Markers**: Add markers with custom sizes and hover text for specific locations
- **Customizable Colors**: Configure min/max colors, land default color, and water color
- **Color Presets**: 6 built-in color themes (blue, green, red, purple, orange, teal)
- **Interactive Legend**: Vertical color legend bar with configurable position and size
- **Responsive Design**: Full viewport fit with no scrolling
- **Real-time Controls**: Live configuration panel to adjust map settings
- **TypeScript Support**: Full TypeScript definitions included
- **Data Loading**: Load from URLs, JSON objects, or use country names
- **Data Validation**: Automatic validation of country codes
- **Country Name Resolution**: Use country names instead of ISO codes
- **Event System**: Callbacks for clicks, hovers, data updates, and errors
- **Utility Functions**: Helper functions for data manipulation
- **No Zoom**: Clean, fixed view without zoom interactions
## Installation
### Using NPM
```bash
npm install interactive-world-map
```
### Using CDN
```html
```
### Local Installation
1. Download the package
2. Include the required files in your HTML:
```html
```
## Quick Start
### Basic Usage
```html
```
### With Bubble Markers
```javascript
const markers = [
{ location: 'New York', lat: 40.7128, lon: -74.0060, size: 20, text: 'New York Population: 8.3M' },
{ location: 'London', lat: 51.5074, lon: -0.1278, size: 15, text: 'London Population: 9M' },
{ location: 'Tokyo', lat: 35.6762, lon: 139.6503, size: 25, text: 'Tokyo Population: 14M' }
];
const config = {
containerId: 'map-container',
minColor: '#8db5d5',
maxColor: '#0d5592',
markers: markers
};
const map = new InteractiveMap(config);
map.render(data);
```
### Loading Data from URL
```javascript
const map = new InteractiveMap('map-container', config);
// Load from JSON file
await map.loadData({
url: 'https://example.com/country-data.json',
validateCodes: true
});
// Or load from object with country names
await map.loadData({
data: {
'United States': 100,
'United Kingdom': 80,
'France': 75
},
useCountryNames: true
});
```
### Using Color Presets
```javascript
const map = new InteractiveMap('map-container');
map.render(data);
// Apply a color preset
map.applyColorPreset('green'); // Options: blue, green, red, purple, orange, teal
// Or get all presets
const presets = InteractiveMap.getColorPresets();
```
### Event Callbacks
```javascript
map.setCallbacks({
onLoad: () => console.log('Map loaded!'),
onDataUpdate: (data) => console.log('Data updated:', data),
onError: (error) => console.error('Error:', error),
onCountryClick: (code, value) => console.log(`Clicked ${code}: ${value}`)
});
```
### Adjusting Bubble Sizes
```javascript
// Make all bubbles 1.5x larger
map.setBubbleSizeMultiplier(1.5);
// Make bubbles smaller
map.setBubbleSizeMultiplier(0.7);
// Reset to original size
map.setBubbleSizeMultiplier(1);
```
### Using Utility Functions
```javascript
// Generate sample data for testing
const sampleData = MapUtils.generateSampleData(20);
map.render(sampleData);
// Generate sample markers
const markers = MapUtils.generateSampleMarkers(5);
map.updateMarkers(markers);
// Get top 10 countries
const topCountries = MapUtils.getTopCountries(data, 10);
// Normalize values to 0-100 range
const normalized = MapUtils.normalizeValues(data);
// Filter by region
const europeData = MapUtils.filterByRegion(data, 'europe');
```
## Configuration Options
### Basic Configuration
| Option | Type | Default | Description |
|--------|------|---------|-------------|
| `containerId` | string | `'map-container'` | ID of the container element |
| `minColor` | string | `'#8db5d5'` | Color for minimum data values |
| `maxColor` | string | `'#0d5592'` | Color for maximum data values |
| `landDefaultColor` | string | `'#e0e8f0'` | Color for countries without data |
| `waterColor` | string | `'#a8c5dd'` | Color for oceans and seas |
### Legend Configuration
| Option | Type | Default | Description |
|--------|------|---------|-------------|
| `colorBarX` | number | `0.98` | Horizontal position (0-1, right-aligned) |
| `colorBarY` | number | `0.15` | Vertical position from bottom (0-1) |
| `colorBarLen` | number | `0.3` | Length of the color bar (0-1) |
| `colorBarThickness` | number | `12` | Thickness in pixels |
### Marker Configuration
Each marker in the `markers` array should have:
```javascript
{
location: string, // Name of the location
lat: number, // Latitude
lon: number, // Longitude
size: number, // Size of the bubble (1-50)
text: string // Hover text (supports HTML)
}
```
## API Reference
### InteractiveMap Class
#### Constructor
```javascript
new InteractiveMap(config)
```
Creates a new map instance with the specified configuration.
**Parameters:**
- `config` (Object): Configuration object with the options listed above
#### Methods
##### render(data, markers)
```javascript
map.render(data, markers)
```
Renders the map with the specified data and markers.
**Parameters:**
- `data` (Object): Country data as key-value pairs where keys are ISO 3-letter country codes
- `markers` (Array, optional): Array of marker objects to display on the map
**Example:**
```javascript
const data = {
'USA': 100,
'GBR': 80,
'CHN': 95
};
const markers = [
{ location: 'New York', lat: 40.7128, lon: -74.0060, size: 20, text: 'NYC' }
];
map.render(data, markers);
```
##### loadData(options)
```javascript
await map.loadData(options)
```
Load data from a URL or object with optional validation and conversion.
**Parameters:**
- `options` (Object):
- `url` (string, optional): URL to load JSON data from
- `data` (Object, optional): Data object to load directly
- `useCountryNames` (boolean, optional): Convert country names to ISO codes
- `validateCodes` (boolean, optional): Validate country codes (default: true)
- `markers` (Array, optional): Markers to display
**Example:**
```javascript
await map.loadData({
url: 'data.json',
validateCodes: true
});
```
##### updateData(data)
```javascript
map.updateData(data)
```
Update map data without full re-initialization.
**Parameters:**
- `data` (Object): New country data
##### updateMarkers(markers)
```javascript
map.updateMarkers(markers)
```
Update or add markers to the map.
**Parameters:**
- `markers` (Array): Array of marker objects
##### setBubbleSizeMultiplier(multiplier)
```javascript
map.setBubbleSizeMultiplier(multiplier)
```
Adjust the size of all bubble markers by a multiplier.
**Parameters:**
- `multiplier` (number): Size multiplier (e.g., 1.5 for 150% size, 0.5 for 50% size)
**Example:**
```javascript
// Make bubbles 1.5x larger
map.setBubbleSizeMultiplier(1.5);
// Make bubbles smaller
map.setBubbleSizeMultiplier(0.75);
```
##### setCallbacks(callbacks)
```javascript
map.setCallbacks(callbacks)
```
Set event callback functions.
**Parameters:**
- `callbacks` (Object): Object with callback functions
- `onLoad`: Called when map finishes loading
- `onDataUpdate`: Called when data is updated
- `onError`: Called on errors
- `onCountryClick`: Called when country is clicked
- `onMarkerClick`: Called when marker is clicked
##### setTheme(theme)
```javascript
map.setTheme(theme)
```
Change the map theme.
**Parameters:**
- `theme` (string): 'light' or 'dark'
##### applyColorPreset(preset)
```javascript
map.applyColorPreset(preset)
```
Apply a built-in color preset or custom preset.
**Parameters:**
- `preset` (string|Object): Preset name ('blue', 'green', 'red', 'purple', 'orange', 'teal') or preset object
##### validateCountryCodes(data)
```javascript
const invalid = map.validateCountryCodes(data)
```
Validate country codes in data.
**Parameters:**
- `data` (Object): Country data to validate
**Returns:** Array of invalid country codes
### Static Methods
##### InteractiveMap.countryNameToCode(name)
```javascript
const code = InteractiveMap.countryNameToCode('United States');
// Returns: 'USA'
```
Convert country name to ISO 3-letter code.
**Parameters:**
- `name` (string): Country name
**Returns:** ISO code or null if not found
##### InteractiveMap.getColorPresets()
```javascript
const presets = InteractiveMap.getColorPresets();
```
Get all available color presets.
**Returns:** Array of color preset objects
## MapUtils Helper Library
The package includes `map-utils.js` with helpful functions for data manipulation:
### Available Functions
#### generateSampleData(countries)
Generate random sample data for testing.
```javascript
const data = MapUtils.generateSampleData(20); // 20 random countries
```
#### generateSampleMarkers(count)
Generate random markers for testing.
```javascript
const markers = MapUtils.generateSampleMarkers(5); // 5 random city markers
```
#### csvToMapData(csv)
Convert CSV string to map data format.
```javascript
const csv = `code,value
USA,100
GBR,80`;
const data = MapUtils.csvToMapData(csv);
```
#### getTopCountries(data, n)
Get top N countries by value.
```javascript
const top10 = MapUtils.getTopCountries(data, 10);
```
#### normalizeValues(data)
Normalize all values to 0-100 range.
```javascript
const normalized = MapUtils.normalizeValues(data);
```
#### filterByRegion(data, region)
Filter countries by region. Available regions: `north-america`, `south-america`, `europe`, `asia`, `middle-east`, `africa`, `oceania`.
```javascript
const europeOnly = MapUtils.filterByRegion(data, 'europe');
```
#### mergeData(datasets, method)
Merge multiple datasets using different methods: `sum`, `average`, `max`, `min`.
```javascript
const merged = MapUtils.mergeData([data1, data2, data3], 'average');
```
#### sortByValue(data, ascending)
Sort countries by value.
```javascript
const sorted = MapUtils.sortByValue(data, false); // Descending order
```
## Country Codes
The map uses ISO 3166-1 alpha-3 country codes. Common examples:
- `USA` - United States
- `GBR` - United Kingdom
- `FRA` - France
- `DEU` - Germany
- `CHN` - China
- `JPN` - Japan
- `IND` - India
- `BRA` - Brazil
- `CAN` - Canada
- `AUS` - Australia
For a complete list, see [ISO 3166-1 alpha-3](https://en.wikipedia.org/wiki/ISO_3166-1_alpha-3).
## Demo
**[Try the Live Demo](https://world-map-woad-three.vercel.app/)** - Interactive configuration panel with all features
The package includes a demo file (`demo.html`) that provides a full interactive configuration panel. Open it in a browser to:
- Adjust colors in real-time
- Configure legend position and size
- Add and test bubble markers
- Toggle various map settings
```bash
npm run demo
```
## Code Examples
The package includes an `examples.html` file with comprehensive code examples showing:
- Basic map setup
- Adding bubble markers
- Customizing colors
- Dynamic data updates
- Multiple configuration scenarios
## Browser Support
- Chrome (latest)
- Firefox (latest)
- Safari (latest)
- Edge (latest)
## Dependencies
- [Plotly.js](https://plotly.com/javascript/) (^2.27.0)
## License
MIT
## Repository
[https://github.com/ehteshamnasim/interactive-world-map](https://github.com/ehteshamnasim/interactive-world-map)
## Issues
Report issues at: [https://github.com/ehteshamnasim/interactive-world-map/issues](https://github.com/ehteshamnasim/interactive-world-map/issues)
## Contributing
Contributions are welcome! Please feel free to submit a Pull Request.